One question, asked well and asked regularly, can track whether your customers are quietly drifting away or turning into fans. That's the appeal of an NPS survey: a single 0-to-10 question that rolls a fuzzy feeling ("do people actually like us?") into a number you can watch move. It's also widely misused, treated as a vanity metric or sent so often that it annoys the very people it measures. This guide covers the NPS question itself, exactly how the score is calculated, what a good score looks like, and when to send the survey so it earns its answer.
What Is an NPS Survey
An NPS survey is a short survey built around one rating question: "How likely are you to recommend us to a friend or colleague?", answered on a scale from 0 to 10. NPS stands for Net Promoter Score, and the idea is that willingness to recommend captures loyalty better than a plain satisfaction rating, because recommending something puts your own reputation on the line. The concept came out of a 2003 Harvard Business Review article by Fred Reichheld, "The One Number You Need to Grow", and it spread fast because it's simple to ask and simple to report.
Why "recommend" and not just "are you satisfied"? Satisfaction is cheap to give and easy to inflate; people will call themselves satisfied and still quietly leave. Recommending is a stronger signal because it costs the respondent something, their own standing with whoever they'd recommend you to. That's the bet NPS makes: that what people will stake their reputation on predicts loyalty better than how they rate a single transaction in the moment.
The 0-to-10 rating is the heart of it, but a good NPS survey almost always pairs it with one open follow-up question asking why. The number tells you the temperature; the follow-up tells you the reason. Without the "why," a falling score just tells you something is wrong without saying what, which is the difference between a metric you can act on and one you can only worry about.
Mechanically, the rating is a scaled question, the same family as a Likert scale or a star rating, just with a specific 0-to-10 range and a specific way of bucketing the answers. That bucketing is where the score comes from, so it's worth understanding before you send anything.
How NPS Is Calculated
NPS isn't an average of the 0-to-10 ratings. It's a calculation built on splitting respondents into three groups based on their score.
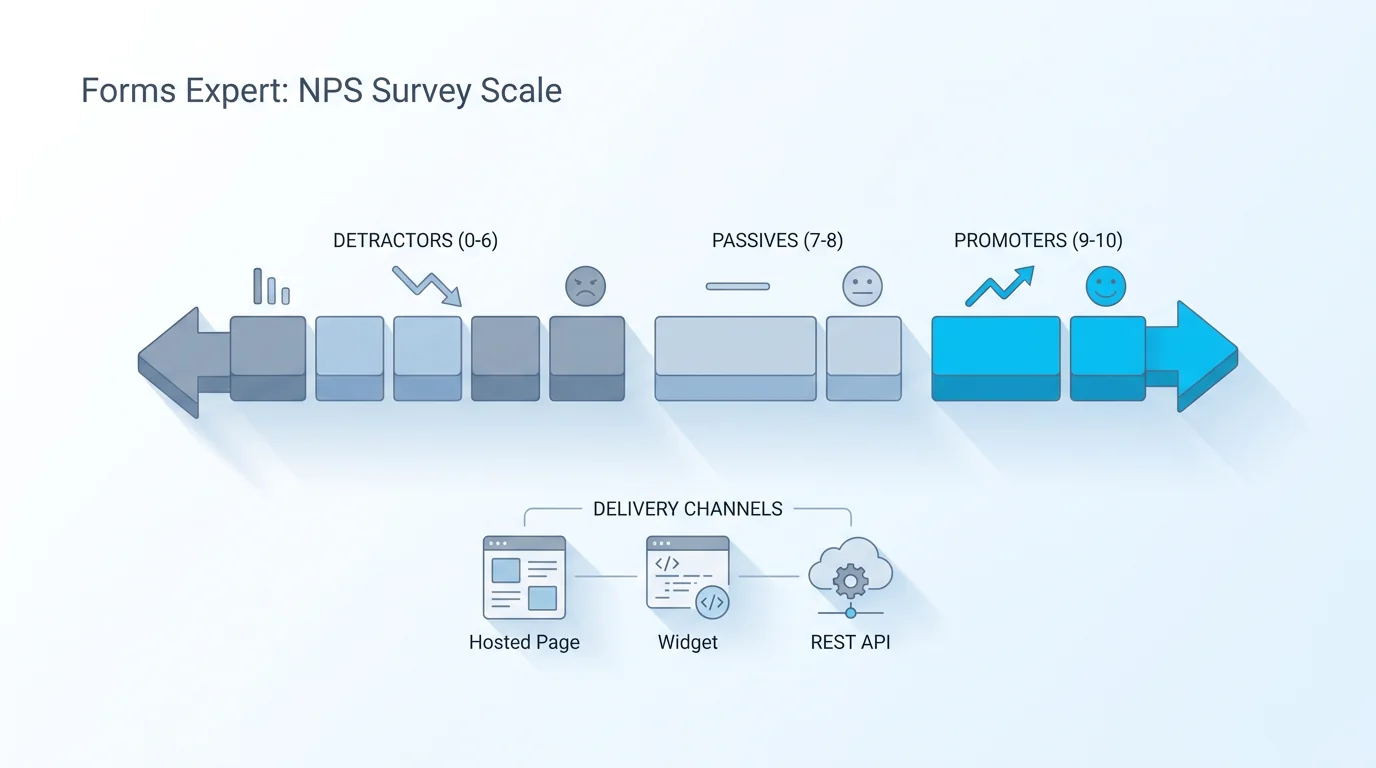
Every answer falls into one of three buckets: promoters, passives, or detractors. Then you ignore the passives entirely and subtract the percentage of detractors from the percentage of promoters. The result is your Net Promoter Score.
The formula is: NPS = % promoters − % detractors. A worked example makes it concrete. Say 100 people answer: 60 are promoters, 25 are passives, and 15 are detractors. That's 60% promoters minus 15% detractors, which gives an NPS of 45. The passives count toward the total (they're part of the 100) but they don't move the score directly, which is deliberate: lukewarm customers neither help nor hurt your word of mouth.
One thing the formula hides is sample size. With twenty responses, a couple of detractors swing the score wildly, so an NPS built on a handful of answers is noise dressed up as a number. Wait for a reasonable batch before you read anything into the figure, and be especially careful comparing two periods that had very different response counts.
A note on doing this in practice: in Forms Expert, building the 0-to-10 question and collecting the responses is available on every plan, including Free. The automatic NPS scoring, which sorts responses into promoters, passives, and detractors and rolls up the score for you, is part of the Pro analytics. On Free you can still run the full survey and calculate the score yourself from the raw responses using the formula above. So nobody is blocked from running an NPS survey; the paid tier just does the arithmetic and segmentation automatically instead of by hand.
| Segment | Score (0 to 10) | What it means |
|---|---|---|
| Promoters | 9 to 10 | Loyal enthusiasts likely to recommend you and stay |
| Passives | 7 to 8 | Satisfied but unenthusiastic, easily tempted away |
| Detractors | 0 to 6 | Unhappy customers who can spread negative word of mouth |
NPS Survey Question Examples and the Follow-Up
The core NPS question barely changes, but the small variations matter. The classic relational wording is: "How likely are you to recommend [company] to a friend or colleague?" For a transactional survey you anchor it to a moment: "Based on your recent support ticket, how likely are you to recommend [company]?" Both use the same 0-to-10 scale; only the framing shifts.
Label the ends of the scale so there's no ambiguity: mark 0 as "not at all likely" and 10 as "extremely likely." An unlabeled 0-to-10 row invites people to read the direction backward, and a handful of flipped answers quietly corrupts the score.
The follow-up question is where the real insight lives, and it should be open-ended so people can answer in their own words. A few that work:
- What's the main reason for your score?
- What's the one thing we could do better?
- What did we get right?
A nice touch is to branch the follow-up on the score: ask detractors what went wrong, ask promoters what they love (their words make great testimonials and marketing copy). That branching is a conditional logic job, and it keeps the survey feeling personal rather than generic. The open follow-up is what turns NPS from a bare number into something you can act on, so don't skip it to save people three seconds. For more on pairing a scaled question with the right follow-up format, the types of survey questions guide covers the mechanics.
What Is a Good NPS Score
NPS runs from −100 (every respondent is a detractor) to +100 (everyone's a promoter). The first bar to clear is simple: any score above 0 means you have more promoters than detractors, which is genuinely positive. Below 0 and more people are talking you down than up.
Beyond that, be careful with benchmarks. A widely cited rule of thumb treats scores above 50 as excellent and above 70 as world-class, but those thresholds deserve real skepticism. What counts as a good score varies a lot by industry, region, customer type, and exactly how the survey was run, so a number that's mediocre in one context is outstanding in another. Comparing your raw NPS to a competitor's published figure is mostly a trap, because you rarely know how theirs was collected. Wikipedia's entry on Net Promoter Score is a good neutral read on both the method and the well-documented criticisms of it.
Benchmark tables do exist (Qualtrics, among others, publishes industry figures in its guide to Net Promoter Score), but read them as rough orientation rather than targets. How a benchmark was collected, the audience, the channel, the exact wording, shapes the number as much as the underlying loyalty does.
Here's the honest version: your most useful benchmark is your own past score. An NPS of 30 means little in isolation, but an NPS that climbed from 20 to 30 over two quarters means you're doing something right, and one that slid the other way is an early warning worth chasing down. Treat NPS as a trend you own, not a trophy you compare.
When to Send an NPS Survey
Timing decides whether your NPS survey gets honest answers or gets ignored. There are two clocks to think about: the moment in the customer's journey, and how often you ask.
For a transactional survey, send it shortly after a meaningful interaction, while it's fresh: a few hours to a day after a support ticket closes, an order ships, or onboarding finishes. Wait too long and the memory fades; send it instantly and you may catch people before they've actually experienced the outcome. For a relational survey, the trigger is the calendar rather than an event, and a steady cadence (many teams land on quarterly) lets you see the trend without wearing people out.
The cardinal sin is over-surveying. If a customer gets an NPS request after every single interaction, they stop answering thoughtfully or stop answering at all, and your response rate (and your relationship) suffers. Cap how often any one person is asked, even if that means some interactions go unsurveyed. A smaller number of considered responses beats a flood of reflexive ones. The terms "when to send an NPS survey" and "best time to send" get searched constantly precisely because getting this wrong is so common.
Delivery channel matters too. An NPS question embedded right in the app catches people in context and tends to get higher response rates than the same question buried in an email a day later, though email reaches the people who've already drifted out of the product. Match the channel to who you most need to hear from.
| Relational NPS | Transactional NPS | |
|---|---|---|
| The question | Overall, how likely are you to recommend us? | Based on your recent [interaction], how likely are you to recommend us? |
| When it's sent | On a fixed cadence, often quarterly | Right after a specific interaction |
| What it measures | The overall health of the relationship | The quality of one touchpoint |
| Best for | Tracking loyalty as a long-term trend | Finding which interactions help or hurt |
Transactional vs Relational NPS Surveys
The two flavors of NPS answer different questions, and most mature programs run both. A relational NPS survey asks about the relationship as a whole, on a regular cadence, to track overall loyalty over time. A transactional NPS survey asks about a specific recent experience, triggered by that experience, to find out which touchpoints are pulling your score up or dragging it down.
Think of relational NPS as the thermometer and transactional NPS as the diagnosis. The relational survey tells you your temperature is rising; the transactional ones, tied to support, onboarding, or checkout, tell you which part of the body is causing it. Run relational NPS to know whether things are getting better or worse overall, and layer transactional NPS on the interactions you most want to improve. The table above lays the two side by side. If you're just starting, pick one: relational if you want a single loyalty trend line, transactional if you have a specific experience you're trying to fix.
There's a sequencing argument too: relational NPS is the better first step for most teams, because it gives you one honest trend line with minimal setup. Add transactional surveys once that line tells you something's moving and you want to know which interaction is responsible. Building both at once is a common way to over-engineer a program before you've learned anything from it.
How to Track NPS Over Time
A single NPS reading is almost meaningless. One quarter's 42 could be a great month or a bad one; you can't tell without context. The value is entirely in the trend, which is why NPS is something you track, not something you measure once.
The move is to keep the question and the audience consistent, take readings on a steady cadence, and watch the line rather than any single point. A score that drifts up over three quarters is a real signal; a one-off dip might just be a rough week or a different mix of respondents. Pair the trend with the open follow-up answers and you get both the what (the score is falling) and the why (people keep mentioning slow support).
In Forms Expert, that trend view lives in the Pro analytics, alongside the funnel and per-field stats covered in form analytics beyond counts. On the Free plan you can collect every response and read a basic overview, then calculate and chart the NPS trend yourself from the raw data; the automatic scoring and the over-time dashboard are the Pro upgrade. Either way the principle holds: a number you read once is trivia, and a number you track is a management tool.
One refinement once you have volume: segment the trend. The same overall NPS can hide a rising score among new customers and a falling one among your oldest accounts, and those point to very different problems. Breaking the trend down by plan, tenure, or acquisition channel turns a single line into a map of where loyalty is actually moving.
Run an NPS Survey in Forms Expert
Setting up the survey is the quick part. In Forms Expert, add a 0-to-10 rating question with the recommend wording, then an open follow-up asking why, and you have a working NPS survey, all on any plan including Free. Use conditional logic to branch the follow-up so detractors and promoters get different prompts, and keep the whole thing to those two questions, since an NPS survey that grows a third and fourth question stops being an NPS survey and starts being a chore.
Because every published form is also a hosted page, an embeddable widget, and a REST endpoint, you can deliver the survey wherever the moment happens: emailed after a purchase, embedded in-app after onboarding, or triggered from your backend through the API right when a ticket closes. The survey templates include a ready feedback survey you can trim down to the NPS question if you'd rather not start blank, and a broader customer feedback survey is the natural next step once NPS tells you where to dig.
A small but real tip: keep the 0-to-10 question and its labels identical every time you send it. NPS is only comparable across periods if the instrument doesn't change, so resist rewording the question or relabeling the scale between rounds, even slightly. Consistency is what makes the trend trustworthy.
The honest recap on cost: build and collect on any plan, compute the score by hand on Free, and move to Pro when you want automatic scoring, promoter/detractor segmentation, and the over-time trend dashboard. Start with the one question that matters, add the "why," send it at the right moment, and watch the line. You can build the whole thing from the home page in a few minutes.
Frequently Asked Questions
What is an NPS survey and what is the NPS question?
An NPS survey is a short survey built around one rating question: "How likely are you to recommend us to a friend or colleague?", answered from 0 to 10. NPS stands for Net Promoter Score, and the idea is that willingness to recommend measures loyalty better than plain satisfaction, because a recommendation puts the respondent's own reputation on the line. A good NPS survey pairs the rating with one open follow-up asking why, so you get both the score and the reason behind it. The concept comes from a 2003 Harvard Business Review article by Fred Reichheld.
How is Net Promoter Score calculated?
Split respondents into three groups by their 0-to-10 answer: promoters (9 to 10), passives (7 to 8), and detractors (0 to 6). Then subtract the percentage of detractors from the percentage of promoters. The formula is NPS = % promoters − % detractors, and passives don't factor into the subtraction directly. For example, with 60% promoters, 25% passives, and 15% detractors, the NPS is 60 minus 15, which is 45. The result lands somewhere between −100 and +100. In Forms Expert this scoring is automatic on the Pro analytics, and on Free you compute it yourself from the raw responses.
What is a good NPS score?
Any score above 0 is genuinely positive, since it means you have more promoters than detractors. A common rule of thumb calls scores above 50 excellent and above 70 world-class, but treat those numbers with caution: what's good varies widely by industry, region, and how the survey was run, so comparing your score to someone else's published figure is mostly unreliable. The most honest benchmark is your own trend. An NPS that climbs from one quarter to the next tells you more than any universal threshold, because it reflects your customers and your method specifically.
What's the difference between transactional and relational NPS?
Relational NPS asks about the overall relationship on a regular cadence, often quarterly, to track loyalty as a long-term trend. Transactional NPS asks about a specific recent experience and is triggered by that experience, like a closed support ticket or a completed order, to reveal which touchpoints help or hurt your score. Relational is the thermometer; transactional is the diagnosis. Many mature programs run both: relational to see whether things are improving overall, and transactional on the specific interactions they most want to fix.
When and how often should you send an NPS survey?
For a transactional survey, send it shortly after a meaningful interaction while it's fresh, typically a few hours to a day later. For a relational survey, use a steady calendar cadence such as quarterly so you can see the trend. The most important rule is not to over-survey: if customers get an NPS request after every interaction, they stop answering thoughtfully or stop answering at all. Cap how often any one person is asked, even if some interactions go unsurveyed, because a few considered responses beat a flood of reflexive ones.
What follow-up question should you add after the NPS score?
Add a single open-ended question asking why, since the rating tells you the temperature and the follow-up tells you the reason. "What's the main reason for your score?" works well as a default. A nice refinement is to branch it on the score, asking detractors what went wrong and promoters what they love, which gives you both problems to fix and testimonials to reuse. Keep it to one open follow-up: the value is in the reasons, but adding several questions turns a quick survey into a chore and drops your response rate.