Ask someone "how do you feel about our onboarding?" and you get a paragraph you can't count. Put the same question on a five-point scale from strongly disagree to strongly agree, and you get a number you can track, compare, and chart. That's the whole job of a Likert scale. This guide hands you 25+ ready-to-copy Likert scale examples across agreement, satisfaction, frequency, and more, then shows you how to pick the right number of points and read the results without fooling yourself.
What Is a Likert Scale
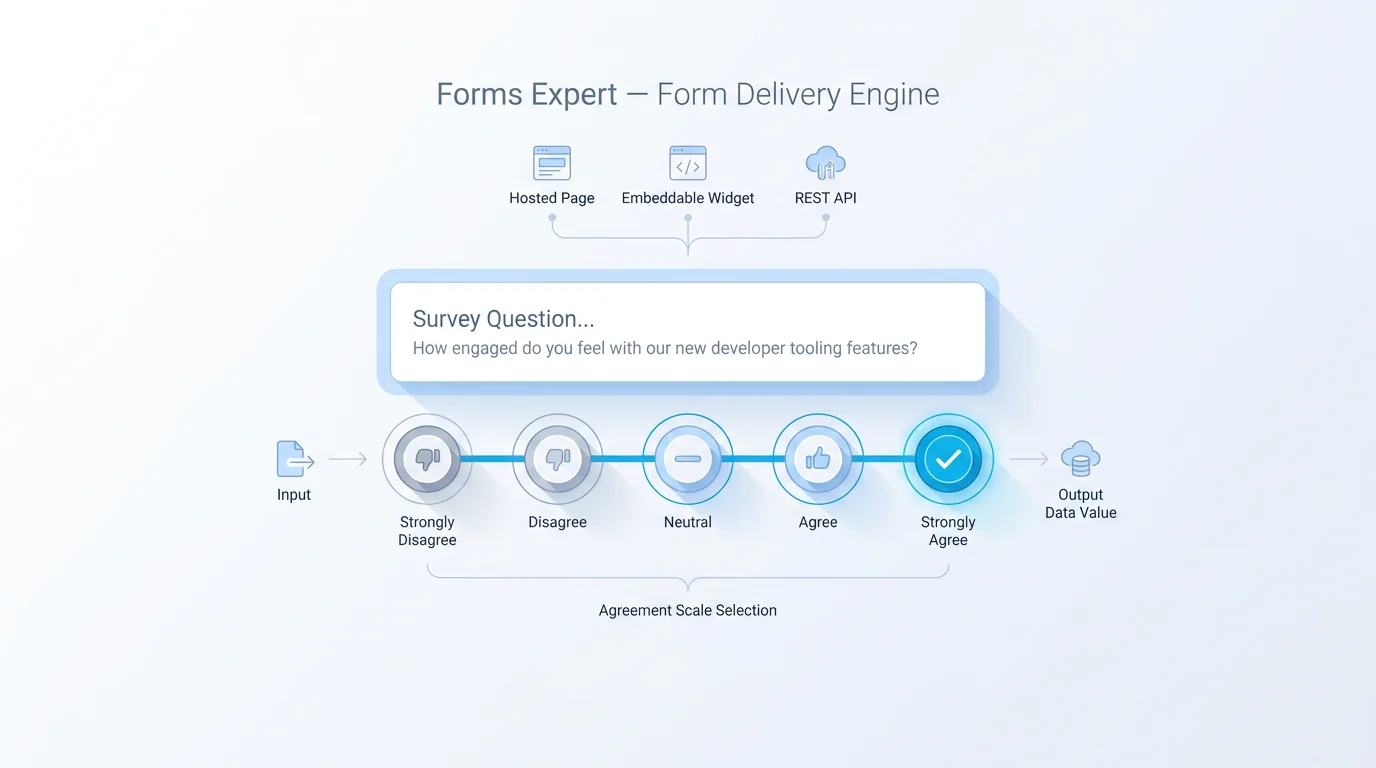
A Likert scale is a survey question format that measures an attitude along an ordered range of options, usually five or seven points running from one extreme to its opposite with a neutral middle. The classic version asks how much you agree with a statement: strongly disagree, disagree, neither agree nor disagree, agree, strongly agree. Each option maps to a position on the scale, so a soft impression turns into ordered data you can summarize.
Psychologist Rensis Likert introduced the format in 1932, and the name stuck (it's "LICK-ert", after him, not "LIKE-ert"). One precise note that trips people up: a single rated statement is a Likert item. A true Likert scale is several related items combined into one score, the way a satisfaction survey might roll six questions into a single number. In everyday use most people call any agree-disagree question a Likert scale, and that's fine here, but the distinction starts to matter once you analyze results.
What makes the format so durable is that it sits between a blunt yes/no and an open text box. Yes/no throws away nuance. Free text can't be counted at scale. A Likert item keeps the nuance and still gives you something to summarize, which is why it shows up in customer feedback surveys, employee check-ins, product research, and academic studies alike. (Technically the spacing between "agree" and "strongly agree" isn't guaranteed to be equal, which is why Simply Psychology classifies Likert data as ordinal. More on why that matters when we get to analysis.)
Part of why the format spread everywhere is that it scales from a one-question pulse check to a fifty-item research instrument without changing how respondents think about it. People already know what agree and disagree mean, so there's almost no learning curve, and the answers slot straight into a chart. That low friction is the real reason it has outlived dozens of trendier question types.
For a fuller menu of formats it sits alongside, see the types of survey questions.
Likert Scale Examples You Can Copy
Here's the part you came for. The fastest way to write a good Likert question is to start from a proven anchor set and swap in your own statement. The table below gives you six anchor families that cover almost every survey you'll write, each shown as a five-point version. Pick the family that matches your question, then attach one of the statements underneath.
Agreement and opinion statements pair with agree-disagree anchors:
- The signup process was easy to complete
- I would recommend this product to a colleague
- The pricing is fair for what I get
- The product does what I expected it to
- I trust this company with my data
Experience questions take satisfaction or quality anchors:
- How satisfied are you with the onboarding experience?
- How satisfied are you with the speed of our support?
- How satisfied are you with the product overall?
- How would you rate the quality of our documentation?
- How would you rate the clarity of our pricing?
Behavior and intent questions use frequency or likelihood anchors:
- How often do you use the dashboard?
- How often do you reach out to support?
- How often do you run into errors?
- How likely are you to renew your subscription?
- How likely are you to recommend us to a friend?
- How likely are you to try a new feature when it launches?
Priority questions use importance anchors:
- How important is a mobile app to your workflow?
- How important are integrations with your existing tools?
That's 20 statements and six anchor sets, well past the 25 you came for. A quick rule that saves you grief later: match the anchor to the verb in your question. "How satisfied were you..." needs satisfaction anchors, not agreement ones. Mixing them ("How satisfied are you? Strongly agree") is the single most common copy-paste mistake, and it makes the answers unreadable.
One more note on the anchors: you can tune the wording to your audience as long as you keep the spacing even. "Strongly agree" can become "completely agree," and "satisfied" can become "happy," but don't stretch one side further than the other. The labels set the ruler, and an uneven ruler measures crooked.
The Iowa State University Extension keeps a useful reference sheet of Likert examples if you want more anchor variations.
| Scale type | Five-point anchors | Best used for |
|---|---|---|
| Agreement | Strongly disagree · Disagree · Neither agree nor disagree · Agree · Strongly agree | Opinion and attitude statements |
| Satisfaction | Very dissatisfied · Dissatisfied · Neutral · Satisfied · Very satisfied | Rating an experience or interaction |
| Frequency | Never · Rarely · Sometimes · Often · Always | How often a behavior happens |
| Likelihood | Very unlikely · Unlikely · Neither likely nor unlikely · Likely · Very likely | Intent to act, renew, or recommend |
| Importance | Not important · Slightly important · Moderately important · Very important · Extremely important | What a respondent values most |
| Quality | Very poor · Poor · Fair · Good · Excellent | Rating an output or deliverable |
5-Point vs 7-Point vs 4-Point Likert Scales
How many points should a Likert scale have? The honest answer is that it depends on how much precision you need and how patient your respondents are. Five is the default for good reason, but it isn't the only sensible choice.
A five-point scale is the workhorse. It's quick to read, everyone understands it, and it gives a neutral middle for people who genuinely don't lean either way. Most satisfaction and agreement surveys should start here.
A seven-point scale adds two more gradations, like a "somewhat agree" between "neither" and "agree." The payoff is sensitivity: with more steps you can detect smaller shifts in attitude between two surveys. Research on scale reliability generally finds gains as you move from three points up to about seven, after which extra options stop helping and just slow people down. Reach for seven points when you're tracking a metric over time and small movements matter, and when your respondents are engaged enough to use the finer steps thoughtfully.
A four-point scale drops the neutral middle on purpose. With no fence to sit on, respondents have to lean positive or negative. That helps when a neutral answer would be a cop-out (a course evaluation where "neither" tells you nothing), but it can frustrate people who really are undecided, and it can nudge answers in a direction they didn't mean. Use it deliberately, not by accident.
The deeper decision is odd versus even. An odd number of points includes a true neutral. An even number forces a choice. Neither is universally right. If a sincere "no opinion" is a real answer, keep the midpoint. If you suspect people will hide in the middle to avoid thinking, drop it. Just don't switch between odd and even within the same survey, because it makes your scales inconsistent and your analysis messier than it needs to be.
If you're not sure and just need to ship, use a five-point scale with a labeled neutral. It's the safest default, it's what most people expect, and you can always test a seven-point version later once you know which questions actually move. Optimizing the point count before you've seen a single response is a classic case of polishing the wrong thing.
| Scale | Neutral midpoint | Strength | Reach for it when |
|---|---|---|---|
| 4-point | No (forced choice) | Removes fence-sitting | A neutral answer would be meaningless and you want a clear lean |
| 5-point | Yes | Fast, familiar, low fatigue | You want a reliable default most people finish easily |
| 7-point | Yes | Finer gradations, more sensitive | You track small changes over time and respondents are engaged |
How to Write Good Likert Scale Questions
Good Likert questions are mostly about discipline. A handful of rules cover almost every case.
Put one idea in each item. "The app is fast and easy to use" is two questions wearing one coat. If someone finds it fast but clunky, they can't answer honestly. Split it into two. This is the rule people break most.
Balance your anchors. The distance from the center to "strongly agree" should mirror the distance to "strongly disagree." Three positive options and two negative ones quietly tilt your results upward. Keep the wording symmetric: if one end is "very satisfied," the other is "very dissatisfied," not just "dissatisfied."
Label every point, not just the ends. Scales that name only the extremes leave the middle to interpretation, and different people read the gaps differently. Naming all the points keeps everyone on the same map.
Keep statements short and concrete. "Support was helpful" beats "The support interaction I had was one in which the representative was helpful in addressing my concern." Long stems lose people.
Avoid negatives in the statement. "The checkout was not confusing" forces a double negative the moment someone disagrees. Flip it to "The checkout was clear."
Keep the battery short. A wall of thirty agree-disagree statements wears people down, and tired respondents start straight-lining, picking the same option down the whole column just to finish. If you need that many items, split them across pages or sections so the form keeps some rhythm. A few sharp questions beat an exhaustive grid every time.
And match the anchor to the question every single time. It's the point from the last section worth repeating because it's that common. The Pew Research Center's guide to writing survey questions is a solid reference if you want to go deeper on wording effects, and our piece on good survey questions covers the habits that apply to every format, not just Likert.
Common Likert Scale Mistakes to Avoid
Even people who know the rules trip on a few predictable mistakes. These are the ones that quietly ruin data.
Double-barrelled items top the list, for the reason above: one statement, two ideas, no clean answer.
Unbalanced scales come next. A scale that runs "okay, good, very good, excellent" has no negative end at all, so it can only flatter you. If you want honest feedback, give people room to be unhappy.
Leading statements push respondents toward the answer you want. "How much did you enjoy our excellent support?" has already decided the support was excellent. Strip the adjectives and let people judge.
Too many points is subtler. A nine-point scale feels precise, but most people can't meaningfully tell point seven from point eight, so you're adding noise, not detail. Past about seven, more points rarely earns its keep.
Acquiescence bias is the human tendency to agree. Given a long row of "do you agree?" statements, plenty of people drift toward "agree" out of politeness or fatigue. You can blunt it by mixing in a few reverse-worded items, where agreeing means something negative, though if you do, remember to flip those scores before you analyze them.
How to Analyze Likert Scale Results
This is where good intentions go to die. The most common move is to average the numbers ("our satisfaction is 4.1 out of 5") and call it a day. It's tempting and sometimes useful, but it rests on a shaky assumption.
Likert responses are ordinal, not interval. The options are ordered, but the gaps between them aren't guaranteed to be equal: the jump from "strongly disagree" to "disagree" may not be the same size as "agree" to "strongly agree." Strictly, averaging ordinal data is questionable, which is why methodologists often prefer the median or the mode, and why Simply Psychology's primer flags the ordinal-versus-interval debate so prominently. In practice, plenty of teams still report a mean for a single item because it's easy to communicate, and that's a defensible shortcut as long as you know its limits.
The more honest summary is usually the distribution: how many people picked each option. A 4.1 average can hide a survey where half love you and half can't stand you, which is a very different story from one where everyone is mildly pleased. A simple top-2-box number (the percentage who chose the top two options) often tells you more at a glance than a mean, and a diverging bar chart that splits positive from negative around the center makes the shape obvious.
Two more habits keep you honest. First, watch your sample size before you read too much into a shift: a satisfaction score moving from 4.0 to 4.2 on eighteen responses is noise, not a trend, and it takes a healthy number of answers before small movements mean anything real. Second, if you used reverse-worded items to fight agreement bias, recode them before you summarize, or a "strongly agree" that was meant as criticism will quietly cancel out a genuine compliment. When you do report a mean, show the distribution next to it rather than instead of it. The average is a fine headline, but the spread underneath is where the story usually hides.
A note on what Forms Expert does here, stated plainly. Collecting Likert responses and seeing a basic results overview is available on every plan, including Free. The deeper analysis layer, per-field statistics and the full analytics views, sits on Pro and up. So Free is enough to run a Likert survey and read the headline numbers. If you want automatic per-question breakdowns and trend tracking over time, that's a paid capability, and it's worth being clear about that before you build.
Build a Likert Scale Survey in Forms Expert
Putting a Likert scale into a live survey takes a couple of minutes. In Forms Expert, add a multiple-choice or rating question, then enter your points as the options, in order, with every point labeled. Reuse one of the anchor sets from the table above and you're most of the way there.
A few build habits keep the data clean:
- Keep the same scale length across related questions so they stay comparable
- Label all the points in the question itself, not just the ends
- Group related items together so respondents settle into one rhythm
Building the survey is all-plans, including Free. There's no gate on collecting Likert responses or on branching your form with conditional logic. When you're ready to publish, the same survey ships as a hosted page, an embeddable widget, or a REST endpoint, so you can drop it on a site or send a link without rebuilding anything. If you'd rather not start from a blank canvas, the survey templates give you a labeled scale to edit. It also helps to preview the survey on a phone before you send it, since long anchor labels that look fine on a laptop can wrap awkwardly on a small screen and change how the scale reads.
The honest line on cost: run the survey and read the basic overview on any plan, and move to Pro when you want the per-field analytics and trend views described above. Start with a clear question and a balanced scale, and the rest is just reading what people tell you.
Frequently Asked Questions
What is a Likert scale?
A Likert scale is a survey question format that measures an attitude along an ordered set of options, usually five or seven points from one extreme to the other with a neutral middle. The familiar version asks how strongly you agree with a statement, from strongly disagree to strongly agree. It turns a vague opinion into ordered data you can count and compare. Strictly, a single rated statement is a Likert item, and a Likert scale is several items combined into one score, though in everyday use the two terms get used interchangeably.
What are some good Likert scale examples?
The most useful examples start from a proven anchor set. For opinions, use agreement anchors (strongly disagree to strongly agree) with statements like "I would recommend this product to a colleague." For experiences, use satisfaction anchors (very dissatisfied to very satisfied) with questions like "How satisfied are you with onboarding?" Frequency anchors (never to always) fit behavior questions, and likelihood anchors (very unlikely to very likely) fit intent questions such as renewal or recommendation. The trick is matching the anchor to the verb in your question, so a "how satisfied" question gets satisfaction options rather than agree-disagree ones.
Should I use a 5-point or 7-point Likert scale?
Start with five points. It's fast, familiar, and gives a neutral middle, which suits most satisfaction and agreement surveys. Move to seven points when you're tracking a metric over time and need to detect small shifts, and when your respondents are engaged enough to use the extra gradations carefully. Beyond about seven points, the added detail usually turns into noise, since most people can't reliably tell one near-identical option from the next.
Should a Likert scale have a neutral middle option?
It depends on whether a sincere "no opinion" is a real answer for your question. An odd number of points (five or seven) includes a true neutral, which respects people who genuinely don't lean either way. An even number (four or six) forces a choice, which helps when a neutral response would be a meaningless cop-out. The risk of forcing a choice is that undecided people get pushed in a direction they didn't intend, so make the call deliberately rather than by habit.
Is Likert scale data ordinal or interval?
It's ordinal. The options are ranked in order, but the distances between them aren't guaranteed to be equal, so the gap from "agree" to "strongly agree" may not match the gap lower down. That's why many analysts report the median, the mode, or the full distribution rather than leaning only on the average.
How do you analyze Likert scale results?
Lead with the distribution, the share of people who chose each option, because it shows the shape of opinion that an average can hide. A top-2-box figure (the percentage picking the top two options) makes an easy headline, and a diverging bar chart that splits positive from negative makes strong and weak spots obvious. Averages are fine for a quick read of a single item as long as you remember the data is ordinal. In Forms Expert, a basic results overview comes on every plan including Free, while per-field breakdowns and trend tracking are part of the Pro analytics.